

Technical FAQ - OpenDAX Enterprise
#Feature questions
How are you presenting the exchange’s trading data into the graphs?
We're consuming the platform's API to pass the trading data into the trading widget which only uses the TradingView frontend library, tradingview.com doesn't interact with the platform at all.
What are the capabilities of Arke?
- Personal Trading: Connect ArkeBot to your exchange accounts and catch juicy trades 24/7.
- Portfolio Management: ArkeBot can manage your asset portfolio as a personal broker assistant, ensuring your portfolio value is always growing no matter what currencies are in it.
- Market Making: ArkeBot can run a constant market-making solution for the stocks and cryptocurrency exchange.
- Liquidity Provision: With ArkeBot, you can hotlink orders from other platforms such as Binance Chain, Huobi, Bitfinex, and others.
- Aggregated Order Book: ArkeBot can seamlessly combine your platform order book with local and remote orders to kickstart your marketplace
#System Architecture and Scaling
How many microservices are there in the Enterprise version and what is the responsibility for each service?
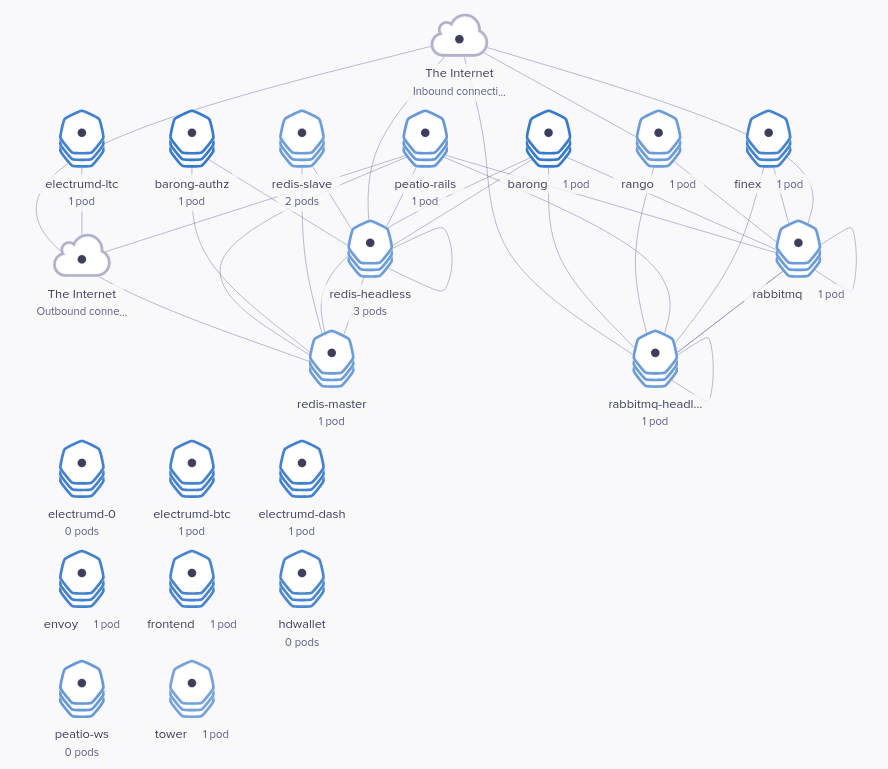
All the system's components have an in-depth description in the architectural documentation, here's a quick overview of each one of them:
- Peatio is the core crypto-exchange engine which handles all the trading and accounting operations
- Finex is the drop-in replacement for the trading engine of Peatio, allowing for high performance and advanced trading features
- Barong is an authentication server created and maintained by our team. It exposes an API for user management and also acts as an authenticator for all the API requests
- Applogic is an intermediate application connected to both Barong and Peatio Management API's. It is designed for extending the stack's functionality, for example adding a payment gateway or a custom AML provider
- Baseapp frontend application is one of the components that can be seen by the end user. It handles all the outside system interaction and is connected directly to the Applogic component
- Tower is the frontend application designed specifically for KyC and user base administration
Can each service be deployed to a separate host?
Our deployment platform of choice is Kubernetes which consists of clusters deployed over multiple hosts in multiple availability zones.
How does each microservice communicate with each other?
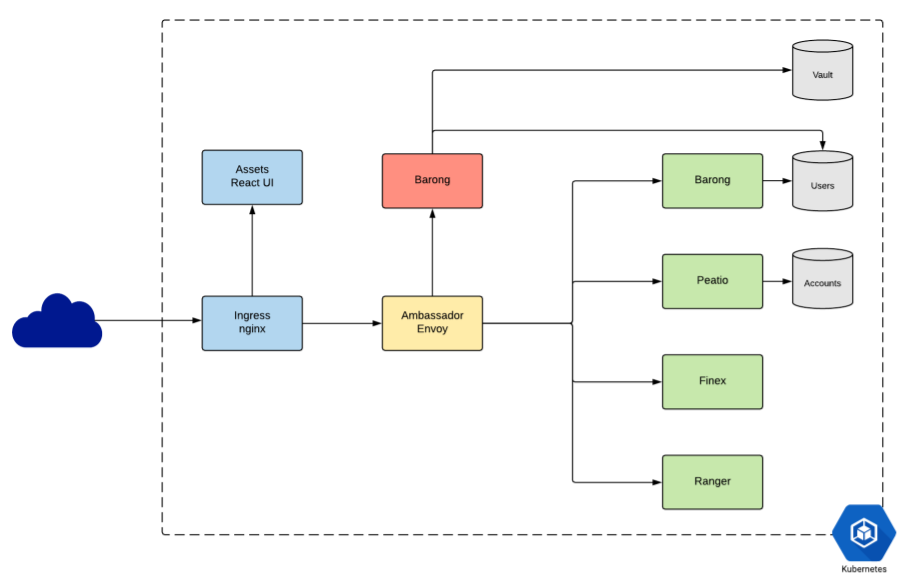
All microservices are located behind an API gateway(Envoy), all the incoming API calls are authorized by Barong AuthZ service which injects JWT to all successful requests.
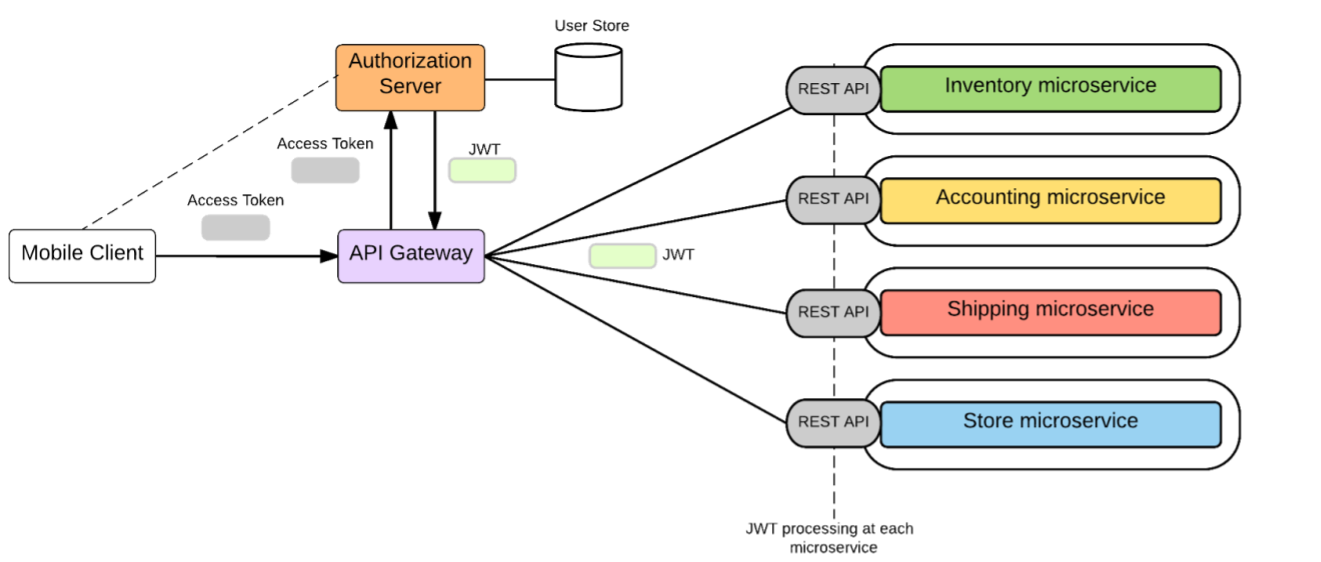
All the inter-microservice messaging is done via Event API, an event-based protocol utilizing RabbitMQ and AMQP with signed JWT payloads. Event API lets components communicate new events(e.g. deposit creation) to all consumers that are listening for such events.
Are you using local DB or cloud DB for application?
We use Google Cloud SQL/Amazon RDS database instances replicated across multiple availability zones for production setups.
Additionally, you can use any database deployment you'd like, either cloud-based or deployed inside of the cluster.
Is the system vertical or horizontal scalable?
The system is scalable since we're using Kubernetes clusters which can be scaled up to hundreds of thousands instances.
#Data Handing
How are you handling sensitive customer data (eg KYC documents) at rest and at transit?
The data is encrypted using RS256 keys, database encryption keys provided by cloud KMS and encrypted at rest using GCS/S3 provided encryption keys.
Where are you storing customer-uploaded KYC documents?
Customer-uploaded KYC documents are stored inside encrypted GCS/S3 buckets.
#Monitoring, logging, and self-healing
How does self-healing works?
Kubernetes restarts containers that fail, replaces containers, kills containers that don't respond health check, and doesn't send traffic to them until they are ready to serve.
How the system detect failures?
We're using Prometheus, Grafana and Alertmanager to monitor the deployment.
Each one of these components is an integral part of Cloud Native Computing Foundation(CNCF), having been designed with flexibility, extendability and cloud workflows in mind.
How does the log aggregation service works?
We're using the ELK stack for our deployments.
Each cluster node has a Fluentd Pod running which gathers all Docker and Kubernetes nodes and pushes them to an Elasticsearch deployment which is then visualized using Kibana.
Any operational cost for logging/monitoring services?
Since all logging and monitoring components are deployed on the same cluster, there aren't any additional operating costs except for infrastructure costs.
#Security
Does the system tracks user devices and asks for a new device confirmation email?
The system tracks user device & browser via their user agents. If the user has enabled 2FA on his account(which is recommended), he'd be required to enter the 2FA code regardless of the device which adds another authentication factor.
#Go live Readiness
What is a UAT installation service and what it does?
We're using deployment tools made from scratch exactly for the purpose of platform deployment along with Terraform, Packer and Helm.
Our deployment system provisions the cloud infrastructure, deploys all cluster dependencies to the cluster and installs all the applications and tools required for a full-fledged platform.
Will you be giving any load tests for the software to run in CI/CD pipeline?
We're using Drone as our preferred CI system, all of our components have comprehensive CI/CD pipelines with tests included.
We have a load testing guide which covers the whole process of benchmarking the deployed platform: